Phenology
Since time immemorial, man has been concerned with the seasonal development of plants. The knowledge of when edible fruits ripen was already indispensable for survival in early human history. The flowering of certain indicator plants serves as a reliable clock and heralds the beginning of the seasons. In agriculture in particular, it is necessary to predict ideal sowing and harvesting dates in order to enable efficient work. This field of research, phenology, is still considered to have great potential today.
Phenology enables small and large scale biomonitoring and could also be used in different departments like forest climatology, agricultural meteorology, urban climatology or climate history. But it could also be used in newer areas, such as pollen flight prediction / medical meteorology.
Observation series of phenology in the Hofgarten (Eichstätt)
Since 2017 the Professorship of Physical Geography / Landscape Ecology and Sustainable Ecosystem Development has been conducting phenological observations in the Hofgarten Eichstätt. This garden harbours approximately 230 trees and shrubs, which represent Europe as well as North American and Asian species. Currently, we have kept 179 floral individuals under scrutiny. This means that every third day, members of the professorship record the state of development of the plants and evaluate these data. On the right, you could see our latest result.
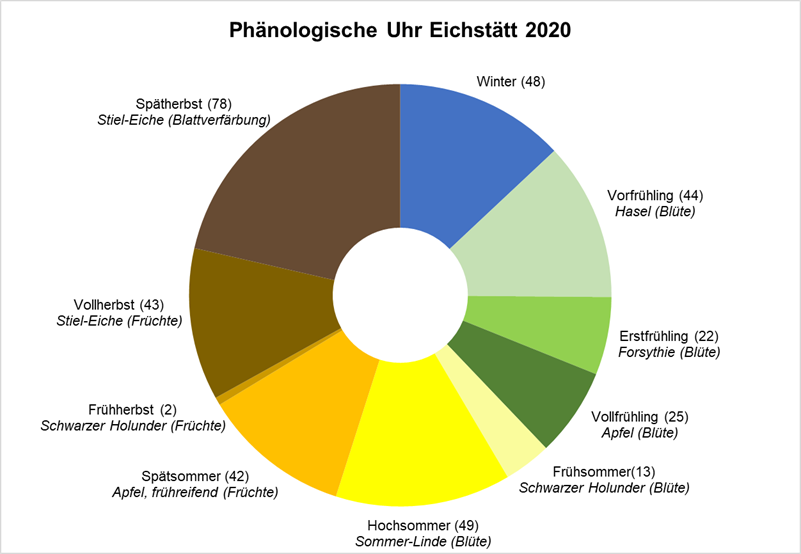
The Phenological Clock
The entry times of selected and characteristic vegetation stages helps to construct the phenological year to represent a location. This could be better to demonstrate graphically with a so-called phenological clock. In such clocks, each phenological season is opened by a leading phase and ends with the beginning of the next season. For a longer time series, it is also possible to display mean values, which are then displayed inside a double clock. In some years, therefore, an evaluation of the shift of seasons can also be carried out. We illustrate the phenological clock for Eichstätt 2019 on the left.